Solutions showcase at DMW
Digital Manufacturing on a Shoestring has set up a ‘DMW factory’ production line which first featured at Digital Manufacturing Week in Liverpool, 10 & 11 November 2021 on the Institute of Manufacturing exhibition stand at Smart Factory Expo. The production line features a live showcase of three low-cost digital solutions: Job tracking, Automated completeness checking and Equipment usage.
Following the Shoestring approach, DMW Factory has implemented three Shoestring low-cost digital solutions to help improve efficiencies on their gearbox production line.
The DMW factory knew that by digitalising some of their processes they could improve efficiencies in their production of gearboxes. But they didn’t know where to start, so they turned to the Digital Manufacturing on a Shoestring project for help.
Watch a run-through of the three digital solutions in the video above: job tracking; automated parts completeness checking; and equipment monitoring.
How the ‘DMW Factory’ followed the Shoestring process:

Needs assessment Workshop
Shoestring did an online needs assessment and technical specification workshop with senior managers in the ‘DMW factory company’. During the 4 hour workshop the company identified 3 business needs /challenges –
- Need to have a clear picture of jobs in progress so that they can track customer orders and plan production process better, predicting accurate lead times needed for different job quantities
- Time is wasted on the production line at the assembly workstation when there are parts missing. Need to have a way to double check that all the correct parts are collected together before they are sent to the assembly station.
- Equipment usage and maintenance needed optimising. When equipment (screwdriver) breaks down during the assembly process time is lost, the maintenance schedule is dependent on the number of hours equipment is in use; therefore they need to monitor equipment usage to schedule maintenance at the optimum time. Additionally, they want to check whether the equipment/ screwdriver is used efficiently at the assembly stage, is it left turned on when not in use? Is it used correctly all the time?
After discussions, the company decided that the easiest solution to implement quickly was job tracking – which would give a clear picture of jobs in progress.
The technical specification was discussed and uploaded into the Shoestring configurator, enabling output of the configured software which, in turn, was uploaded onto the chosen microcomputer, in this case a Raspberry Pi.
Business Need 1: Job Tracking
The company started small, addressing the 1st challenge with the digital solution, job tracking, which was installed at workstations 1 (parts collation), 2 (product assembly) and 3 (packaging & ready for delivery).
- The Challenge: Not know what jobs are out in production, what the work flow is, so can’t plan jobs efficiently, nor give customers real-time updates on the progress of their orders.
- The Solution: Job tracking – installed across 4 different production stages – at the three workstations. The technology used in the solution costs just under £300: the system comprises 4 scanners (at £32 each) and a Raspberry Pi (at £54), a monitor (£85) and open source software (£0).
- Activity at workstations 1,2 &3: the job card (complete with bar code) travels with the parts right through from when the job starts to when the product is ready for dispatch. Four scanners are deployed across the three workstations and are used to scan the barcode on each job card. The data is collected via a Raspberry Pi and transmitted to connected tablet / screen which displays a visual interpretation on a dashboard:
- 1st station – parts are collated, job card is scanned with scanner 1
- 2nd station – product is assembled, job card is scanned with scanner 2;
- 3rd station – packaging product ready, job card is scanned with scanner 3
- 3rd station – product ready for dispatch, job card scanned with scanner 4
- Results: are displayed on a dashboard. The scanners all connect to a Raspberry Pi and their results collated and displayed on a dashboard shown on a monitor that is connected to the Raspberry Pi. In this case the Raspberry Pi is attached to the large monitor mounted on the side panel above workstation 3. The dashboard displays the current status of all jobs, identifying at which stage each job is at: Collect; Assemble, Packing; Complete. It is possible to create historical analysis showing flow of orders (hourly, daily, weekly).
- Benefits: Full visibility of all jobs across the shopfloor, accurate updates can be given to customers, highlights jobs that get lost in the production line, historic data can be analysed to show if there are any workflow issues at any point in the production process, to help plan future job loads.
Business Need 2: Automated parts completeness checking
Once satisfied that the job tracking solution was working, the company addressed business need 2, by introducing a second solution at workstation 1 which would help track all the parts collected ready for assembly.
- The Challenge: How to check that the correct parts are collated at workstation 1 and sent to the assembly workstation, how could an automated process to check collation of parts for each product
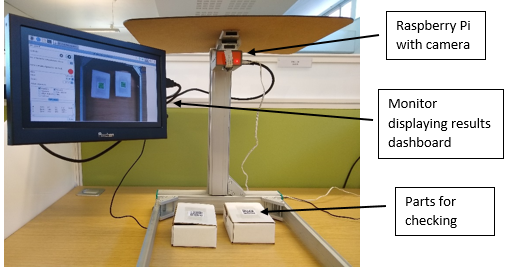
- The Solution: Automated parts completeness checking – once collected, the parts go under a camera which verifies that the right parts are included in the product parts’ collation package. The technology used in this solution costs £155: the system comprises a Raspberry Pi (£25), a Raspberry Pi camera (£25), a monitor (£85), open source software (£0), keyboard & mouse (£20). The fixture was bespoke and hasn’t been costed.
- Activity at workstation 1: A mounted camera scans the QR codes on the grouped products displayed directly beneath it and checks that only the 3 necessary parts are present. Data from the camera is sent to a Raspberry Pi which, using an open source software based on OpenCV, interprets the data as required on an interface which displays on a monitor that is connected to the Raspberry Pi.
- Results: The dashboard on the monitor is programmed to display an alert. If the parts are correct (i.e. the right number and type of parts) then the system shows a green light. Otherwise, if the number of parts is incorrect or the type of parts is incorrect then the system shows a red light. This alert could be connected to a network and create a message. If the data was stored in a data storage module (which could be a database or an excel file) you could then interrogate it and discover additional insights.
- Benefits: Speeds up the checking process for parts, and is more accurate than when the process relies on one operator. Helps ensure the right parts reach the assembly station, saves time wasted when previously incorrect parts were delivered.
Business need 3: Equipment Monitoring
- The Challenge: When equipment breaks down work is halted, so the company needs to predict when equipment needs maintenance based on its use. They also want to check that equipment usage is optimised and power is not wasted.
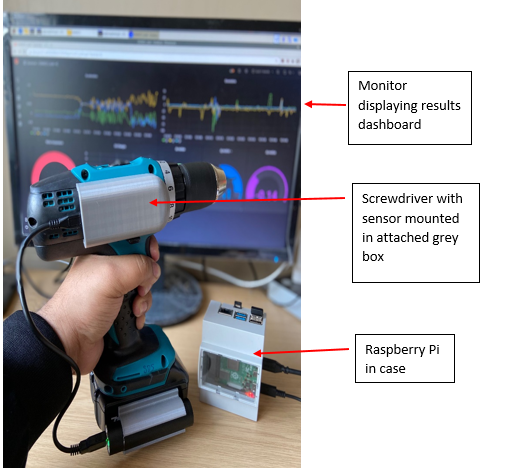
- Solution 3: Equipment usage – a screwdriver is used to assemble the parts, an equipment monitoring system can report when the screwdriver is being used to screw in parts, alerts can be set up to report when the screwdriver has been used for specified amount of time (when needs maintenance); in addition the system can monitor when the screwdriver is in use, how much time it is used to screw parts, how much time it is in action but not correctly assembling parts. Can report total period of time when products are being assembled and current activity. The technology used in this solution costs £140: the system comprises a vibration sensor (£5) with an Arduino ESP8266 (£5), which is powered by a portable battery (£10), a RaspberryPi (£25), a monitor (£85), and open source software (£0). The casings for the vibration sensor and Arduino, and for the portable battery, were 3D printed and their cost not included here.
- Activity at workstation 2: A vibration sensor is attached to the screwdriver, data from the sensor is sent to an Arduino which in turn sends it on to the RPi which is also connected to a monitor. The Raspberry Pi interprets the data and displays the results on the monitor. A battery is also mounted on the screwdriver to charge both the sensor and Arduino.
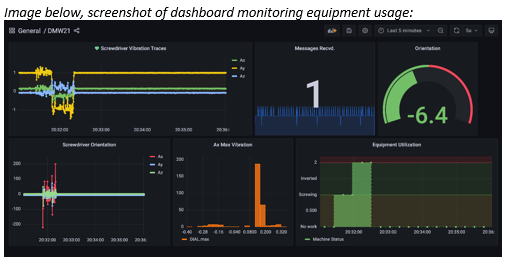
- Results: The dashboard, which is displayed on the attached monitor, displays the real-time equipment usage.
- Benefits: Enables timely intervention to improve equipment performance and usage. Provides an accurate picture of equipment usage, facilitates better scheduling for maintenance; details how often equipment is used to perform the task during time periods; could indicate if equipment is not being used correctly.